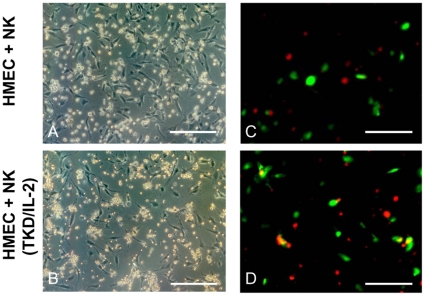
Figure 3. Representative microscopic images of the adherence of TKD/IL-2-activated NK cells to HMECs.
A confluent monolayer of HMECs was co-cultured for 4 h either with resting (A) and TKD/IL-2-activated NK cells (B). Pictures were taken using a Zeiss Axiovert 200 inverted fluorescence microscope. The amount of adherent HMECs was drastically reduced after a co-incubation with activated (B) compared to resting NK cells (A). The number of HMECs co-cultured for 4 h with activated NK cells significantly dropped from 73±5 to 37±3 cells, as determined by counting of an optical field (n = 3, p<0.05). Scale bar, 50 µm. Representative immunofluorescence images of TKD/IL-2-activated NK cells to HMECs. The specific adhesion of activated NK cells, labeled with PKH26GL in red, to HMECs, labeled with FITC in green, is illustrated in orange (D). No co-staining of red and green labels was seen when resting NK cells were used (C). Pictures were taken using a Zeiss Axiovert 200 inverted fluorescence microscope.

