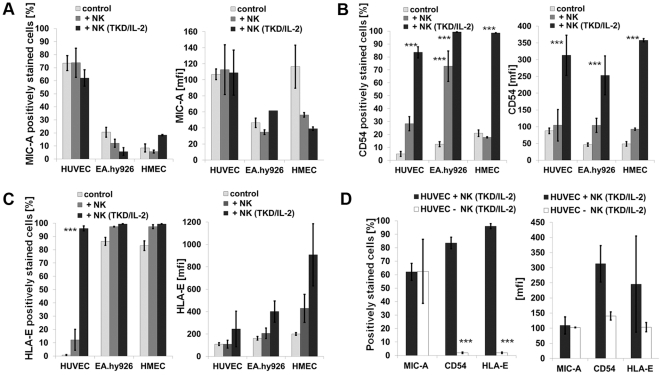
Figure 5. Phenotyping of ECs after contact with resting and activated NK cells.
Comparative analysis of the proportion of HUVECs, EA.hy926 cells and HMECs expressing MIC-A (A), CD54 (B) and HLA-E (C) (left panel) and mean fluorescence intensity values of expression (mfi; right panel) in the absence of NK cells (light grey bars) and after a 12 h co-culture with resting (dark grey bars) or TKD/IL-2-activated (black bars) NK cells. Cell surface marker expression was determined by flow cytometry; ECs and NK cell populations were gated separately based on differences in the forward (FSC) and side scatters (SSC). Asterisks mark values significantly different to control values, ***, p<0.001, as determined by the Mann-Whitney test using the SPSS software. The expression of the cell surface markers indicated above on HUVECs in the presence of TKD/IL-2-activated NK cells (black bars) and after removal of the NK cells (white bars) was determined by flow cytometry. In the absence of NK cells the elevated levels in the expression of CD54 and HLA-E positively stained HUVECs dropped to initially low levels (D). Asterisks mark values which are significantly different to control values, ***, p<0.001, as determined by the Mann-Whitney test using the SPSS software.

