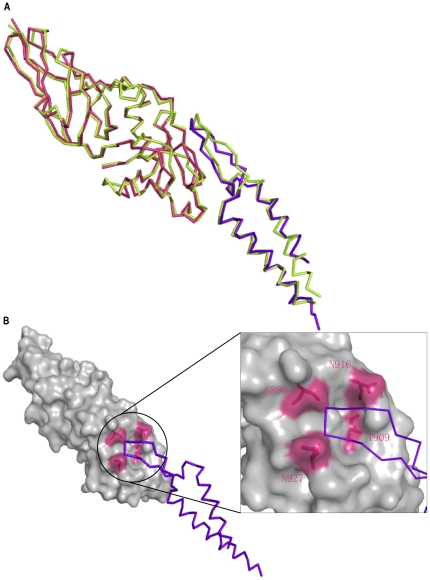
Figure 4. Structural modeling of EHEC intimin-Tir complex and superposition of intimin-Tir complex between EHEC and EPEC.
A) Superposition of intimin-Tir complex between EHEC and EPEC. The crystal structure of EPEC intimin-Tir complex is shown in limon. The EHEC intimin and Tir are indicated in warm pink and purple-blue, respectively. B) Structural modeling of EHEC intimin-Tir complex. Intimin is shown as surface in gray. Four important residues (S890, T909, N916 and N927) are marked in warm pink. Tir is shown in purple-blue ribbon. The region involved in the intimin-Tir binding is enclosed in a black circle, in which the details of the key residues are marked in warm pink.

