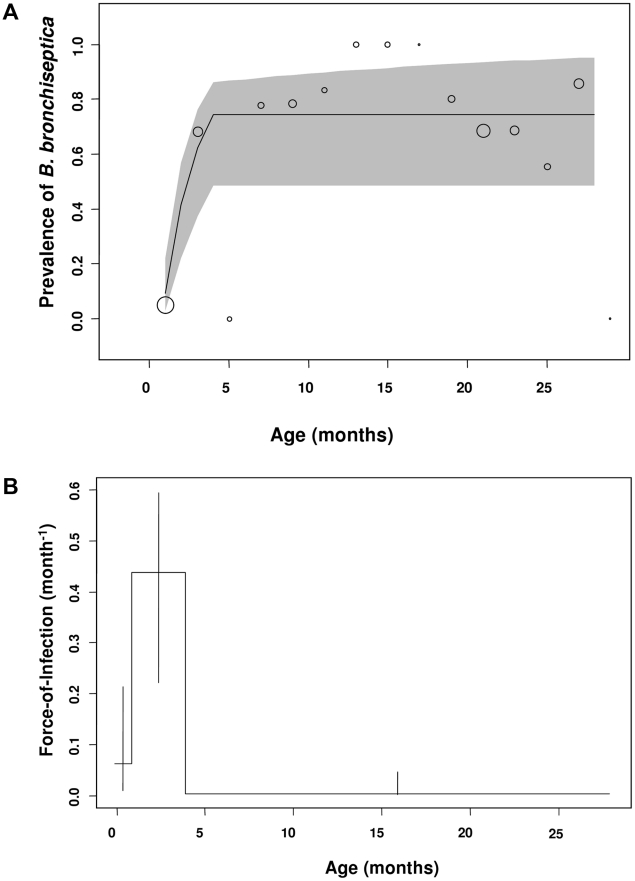
Figure 2. Estimated and observed prevalence of B. bronchiseptica and the force-of-infection estimated in the commercial rabbitry.
(a) Observed (bubble plots) and expected (line graph) cumulative proportions infected by age (P(a)) in equation 1. (b) The fitted force-of-infection (λ(a)) in equation 1. The percentage of rabbits infected in each age-class is presented as a bubble whose size is proportional to the sample size; thus, as FOI estimates were based on data from 214 rabbits, the bubble at 1 month of age for example, represents 59 rabbits. 95% confidence intervals were computed using partial profile likelihood [37].

