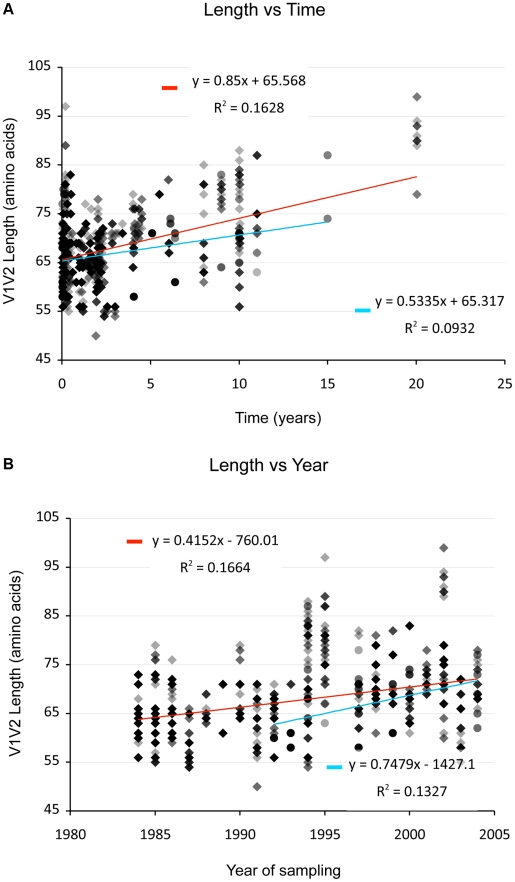
Figure 2. V1V2 length vs. time since infection (upper panel) and vs. year of sampling (lower panel).
Lengths are indicated in amino acids. Overlapping data points appear as darker symbols. Sequences from plasma are represented by diamonds and sequences from PBMC are represented by circles. Regression coefficients and coefficients of determination are shown for univariate linear regression, for plasma (red line) and PBMC (blue line).

