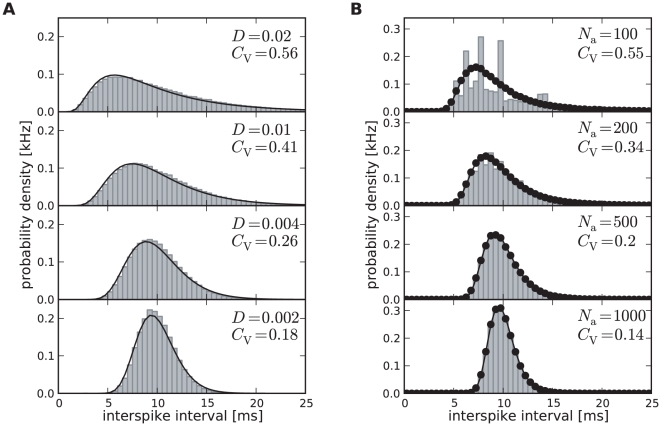
Figure 3. ISI histograms of a PIF neuron – theory vs. simulation.
A ISI densities in the case of deterministic adaptation ( ) for different noise intensities
  . Gray bars show the histograms obtained from simulations of Eq. (2); solid lines display the mean-adaptation approximation, Eq. (64) (inverse Gaussian density). B ISI densities in the case of stochastic adaptation (
 ) for different
  as indicated in the panels. The adaptation current was modeled either by the channel model (gray bars), Eq. (20), or by the diffusion model (circles), Eq. (1). The theory, Eq. (69), is displayed as a solid line. Parameters are chosen as in Fig. 2.

