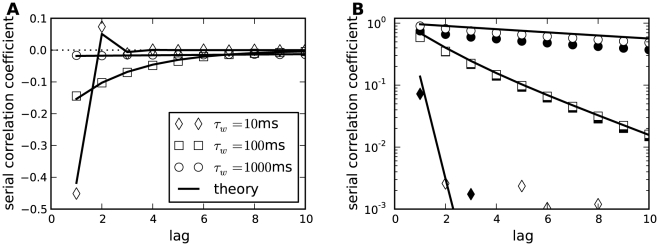
Figure 8. Serial correlation coefficient as a function of the lag between ISIs.
A The case of deterministic adaptation with  for different values of the time constant
  (as indicated in the legend). The theoretical curves, Eq. (9), are depicted by solid lines; the zero baseline is indicated by a dotted line. B The case of stochastic adaptation with
  for different values of the time constant
  (as in A). The channel model, Eq. (20), is represented by white symbols, the diffusion approximation (Eq. (1)) is represented by black symbols. The theory based on the colored noise approximation, Eq. (4), is depicted by a solid line. Other parameters as in Fig. 2.

