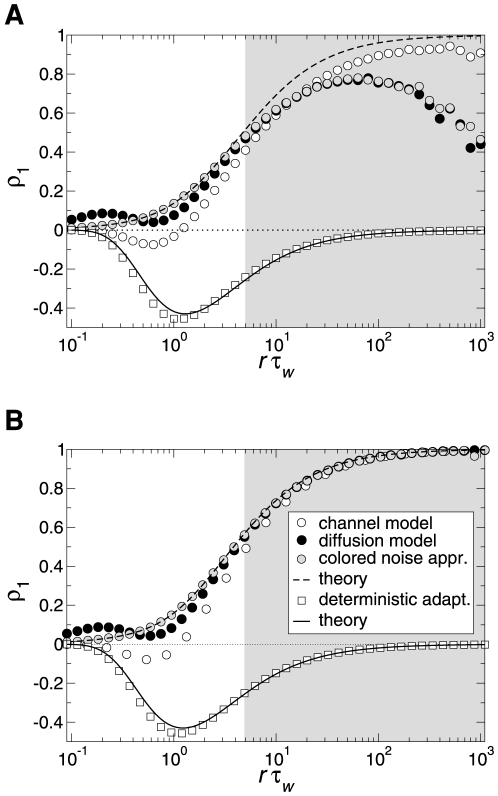
Figure 9. Serial correlation coefficient at lag 1 as a function of the time scale separation.
A Serial correlation coefficient  in the case of
  channels (corresponding to
  ) for stochastic adaptation (circles, Eq. (3)) and
  for deterministic adaptation (squares, Eq. (2)). Theoretical curves for stochastic adaptation, Eq. (72), and deterministic adaptation, Eq. (9), are displayed by a dashed line and a solid line, respectively. The zero baseline is indicated by a dotted line. B shows the corresponding plot for
  channels (corresponding to
  ) and
) and  . The gray-shaded region marks the relevant range for spike-frequency adaptation.
  was varied by changing
  at fixed
  (
( ), all other parameters as in Fig. 2.

