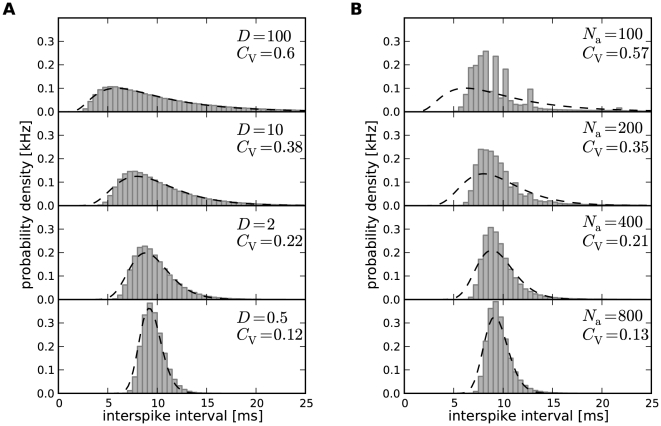
Figure 11. ISI histograms of the Traub-Miles model – deterministic vs. stochastic adaptation.
A The ISI densities of the Traub-Miles neuron model with a deterministic M-type adaptation current ( ) and white noise driving (Eq. (115) – gray bars) is shown along with an inverse Gaussian (Eq. (64)) with the same mean and CV (dashed lines). To keep the firing rate at about
  the external driving current was adjusted from top to bottom according to
  ,
,  ,
,  ,
,  (in
(in  ). Noise intensity
  in units of
  . B The ISI densities of the Traub-Miles model in the presence of a stochastic M-type adaptation current (Eq. (116) – gray bars) is shown along with an inverse Gaussian (Eq. (64)) with the same mean and CV (dashed line). Here, the external driving current was in all cases
  .
.

