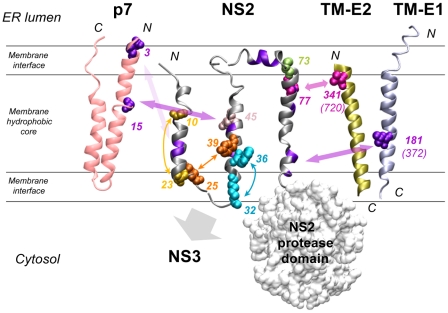
Figure 10. Summary of interactions within NS2 and with HCV proteins as deduced from the genetic analysis.
The structural models of NS2 (this study), p7 [16], the transmembrane domain of E1 (TM-E1;[68]) and E2 (TM-E2; theoretical model) are represented as ribbon. The phospholipid bilayer is indicated tentatively and schematically. Only the side chains of aa encoded by pseudoreversions are shown with spheres correspondíng to van der Waals radia. Residues likely involved in intra- or inter-molecular interactions are indicated with the same color and connected with double arrows. Interactions within and outside of NS2 are represented by small and large double arrows, respectively. The backbone of aa residues with low similarity identified in helix-swap mutants and potentially involved in inter-helix interactions are colored violet as in Figure 1D. The large gray arrow indicates the region of NS2 likely involved in interaction with NS3. Residues colored in pink-gray (position 45) and light green (position 73) correspond to pseudoreversions at the very same site as the original NS2 mutation. Numbering of altered residues in TM-E1 and TM-E2 correspond to JFH1 and numbers in parenthesis correspond to the H77 reference polyprotein. The molecular models of TM-E1 and TM-E2 were constructed by using the Swiss Model server facilities (http://www.expasy.ch/swissmod/). The figure was generated on the basis of the structure coordinates by using the Visual Molecular Dynamics program and rendered with POV-Ray.

