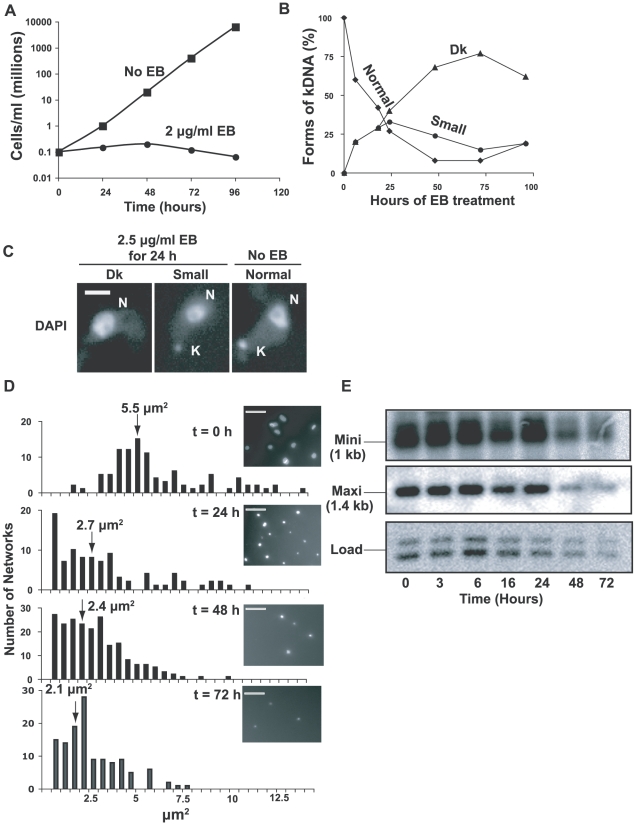
Figure 1. Effects of EB on growth and kDNA.
(A) Effect of EB (2 µg/ml) on growth. Values of parasites/ml on y-axis are measured value times dilution factor. (B) Effect of EB on kinetoplast size. DAPI-stained cells (∼100 per time point) were visually categorized by kinetoplast size. Dk, dyskinetoplastic or no detectable kDNA. (C) Fluorescent images of different-sized kinetoplasts seen in DAPI-stained cells untreated or following EB treatment. Scale bar, 5 µm. (D) Bar graphs showing surface areas, calculated with IPLabs software, of DAPI-stained networks isolated from cells treated for the indicated time with 2 µg/ml EB. Arrows show average size. Insets show a representative field at each time point. Scale bar, 5 µm. (E) Time course of kDNA loss. Total DNA digested with Hind III/Xba I was fractionated on a 1.5% agarose gel (106 cell equivalents/lane). A Southern blot was probed for minicircles (only the 1 kb fragment is shown) and maxicircles (probe recognizes only a 1.4 kb fragment).

