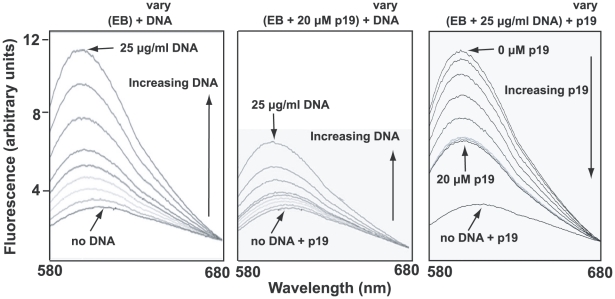
Figure 5. Fluorometric measurement of EB-network binding and the effect of p19.
Binding of EB to kDNA was measured by fluorescence spectroscopy using a Fluoromax-3 fluorometer (Horiba). Excitation was at 525 nm and emission was measured from 580 to 680 with a maximum at 604 nm. Titles above each panel show the components of the reaction. Those in parentheses are at constant concentration and those that vary are indicated. Vertical arrows inside each panel show direction of variation. Left panel shows that EB (6.25 µg/ml) emission fluorescence increases markedly on addition of kDNA networks (0, 0.25, 0.5, 1.25, 2.5, 3, 4, 6.5, 25 µg/ml). In middle panel, the same amount of DNA was pre-incubated with 20 µM p19 (room temperature, 5 min) before adding to EB (6.25 µg/ml). Right panel shows displacement of EB (6.25 µg/ml) from DNA (25 µg/ml) by addition of increasing concentrations of p19 (0, 1, 2, 4, 8, 10, 12.5, 15, 20 µM). In this experiment we used Crithidia fasciculata networks (purified as described [54]) as they are much easier to isolate than those from T. brucei. The preparation of recombinant p19 will be published elsewhere.

