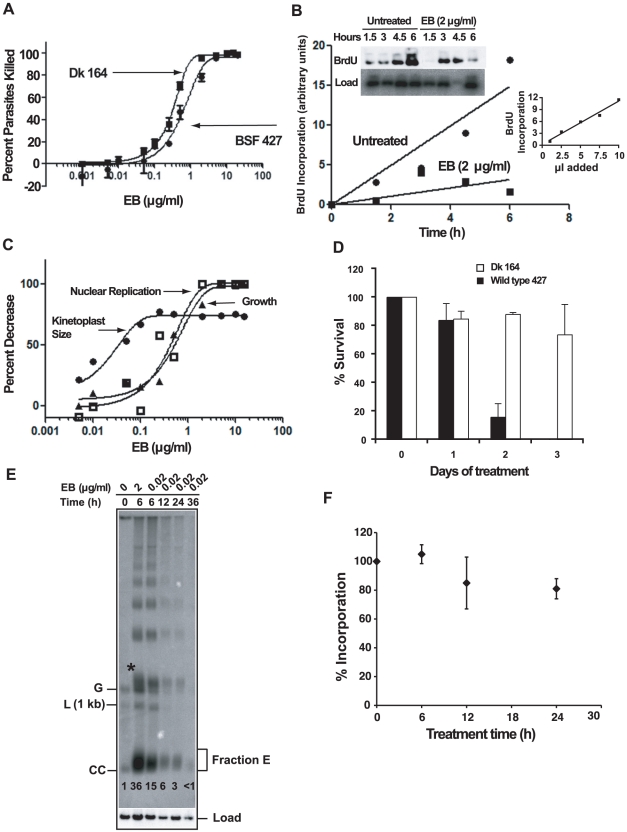
Figure 7. The mechanism of killing BSF trypanosomes by EB.
(A) Effect of EB concentration on killing of wild type 427 and Dk 164 trypanosomes. In a 24 h acid phosphatase-based cytotoxicity assay [38], A405 was measured on a microtiter plate reader (Molecular Devices). Each EB concentration in an experiment was assayed in quadruplicate, and error bars indicate standard deviations for three experiments. Data were fit to the equation for the sigmoidal Emax model [55] using GraphPad Prism software that generated EC50 values of 0.30 µg/ml for Dk cells (R2 = 0.99) and 0.65 µg/ml for wild type (R2 = 0.97). (B) Effect of EB on BrdU incorporation into nuclear DNA of wild type BSF trypanosomes. Cells (105 cells/ml, 10 ml) were incubated with EB (2 µg/ml) and BrdU for up to 6 h. Total DNA at each time point was isolated, fractionated by agarose gel electrophoresis, transferred to a PVDF membrane, probed with anti-BrdU, and labeled DNA was detected by chemiluminescence (quantitated by Image J software; http://rsbweb.nih.gov/ij/). After normalizing for loading using the hexose transporter probe, label in the nuclear DNA band was quantitated by a phosphorimager. Inset graph shows that detection of BrdU was in the linear range (in this experiment, 1, 2.5, 5, 7.5, and 10 µl of the untreated 6 h sample was processed and quantitated with Image J. (C) Effect of EB concentration on kinetoplast size, nuclear replication, and growth of wild type cells. Cells (105 cells/ml, 10 ml) were incubated with the indicated concentrations of EB for 24 h and BrdU was added for the last 2 h. Cytotoxicity (killing) was assayed with 200 µl samples as in Panel A. To measure effect of EB on kinetoplast size, cultures (1 ml) were collected, fixed, stained with DAPI and evaluated by fluorescence microscopy. With regard to kinetoplast size, the reason that some cells retain some kDNA at high EB concentration is not clear. To measure the effect of EB on nuclear DNA replication, total DNA was isolated from remaining samples for electrophoresis as in Fig. 4A; a blot was probed with anti-BrdU and quantitated as in Panel B. Data were fit to the equation for the sigmoidal Emax model as in Panel A. (D) Survival of wild type and Dk trypanosomes in 0.02 µg/ml EB. Cells (5×10⁴/ml) were incubated with 0.02 µg/ml EB and at indicated times were counted by hemocytometer (mean ± standard deviation of 3 independent experiments). Cell densities were maintained between 5×10⁴/ml and 106/ml. (E) Comparison of the effects of EB concentration on free minicircles. The experiment was identical to that in Fig. 2A except that EB was either 2 µg/ml or 0.02 µg/ml. Abbreviations and * are same as in Fig, 2A. This experiment was run 3 times with virtually identical results. The fraction E smear in the second lane is narrower than that in Fig. 2A for unknown reasons. The numbers in each lane below fraction E are relative band intensities of fraction E plus covalently-closed minicircles determined by phosphorimaging and corrected for background and load. (F) Effect of 0.02 µg/ml EB on nuclear DNA replication. A culture was treated with EB and at indicated times, cells (200 µl, 2×10⁶/ml) were incubated with [3H]thymidine (Perkin-Elmer, 300 µCi/ml, 20 Ci/mmole) in thymidine-free HMI-9 for 2 h (the serum may contain low levels of thymidine). At the end of the labeling, radioactivity was measured in 5% TCA-precipitable DNA. Values on Y-axis are percent of incorporation into untreated cells. The latter incorporated 10.5×10³±2.8×10³ dpm in 2 h. Roughly 5% of the zero time incorporation should be in kDNA. Each experiment was run with duplicate samples, and plotted values are Mean ± S.D. of three independent experiments.

