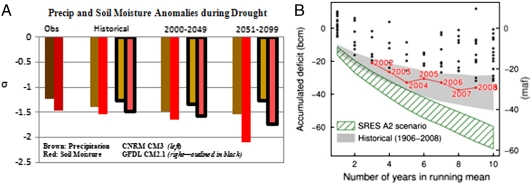
Fig. 5.
(A, Left) Composite of water year precipitation and water year soil moisture (Red) anomalies associated with extreme negative soil moisture anomalies for Southwest from historical observation and simulated climate input from CNRM CM3 and GFDL CM2.1 GCMs SRES A2 emission scenario—historical period 1951–1999, early 21st century 2000–2049 period, and late 21st century 2050–2099 period. In the figure, precipitation and soil moisture composites are shown side by side. For climate model simulation, composites from CNRM CM3 are shown first, and then from GFDL CM2.1, for each time epoch. (B, Right) Accumulated deficit in flow [10**9 m**3, or billions of cubic meters(bcm)] on the Colorado River at Lees Ferry, relative to the mean flow observed over the period 1906–2008. Deficit is calculated in N-year running means (X axis). The 21st century drought is shown in red; other years are shown as black dots. Gray shading indicates where, 2/3 of the time, the worst drought of the century should fall; the green hatched region shows the same thing for the end of this century, estimated from downscaled climate models. The right hand axis additionally shows values in millions of acre-feet (maf). See text for details. (For Sacramento at Bend Bridge, see Fig. S6).

