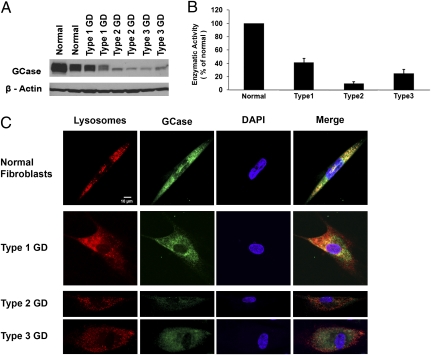
Fig. 1.
Quantification of GCase expression levels and measurement of enzyme activity in GD phenotypes. (A) Western blot of expression of GCase protein in cultured fibroblast cell lines derived from normal individuals and patients with GD. (B) Enzyme activity assay for GCase using equivalent amount of total protein from normal fibroblasts and GD phenotypes with results plotted as a ratio to the average enzymatic activity of normal fibroblasts. (C) Immunofluorescence staining for lysosomes (red) and GCase (green) in cultured fibroblasts derived from patients with GD and normal individuals. Decreased intensity of staining of GCase as well as reduced localization of GCase in lysosomes is apparent in types 2 and 3 GD fibroblasts compared with that in normal cells. The nuclei of cells are counterstained with DAPI (blue).

