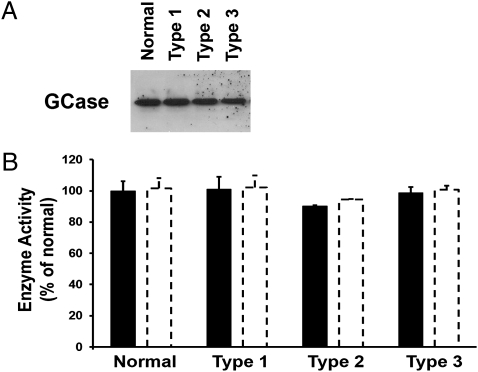
Fig. 2.
Measurement of catalytic activity of immunoprecipitated GCase from normal and GD fibroblasts. (A) Western blot of immunoprecipitated GCase demonstrating similar quantities of GCase in normal and GD and cell lines. (B) Catalytic activity of immunoprecipitated GCase from normal and GD fibroblasts measured at concentrations of 50 ng (solid bars) and 100 ng (open bars) per assay. GCase activity from each GD phenotype is plotted as a percentage of the average normal value.

