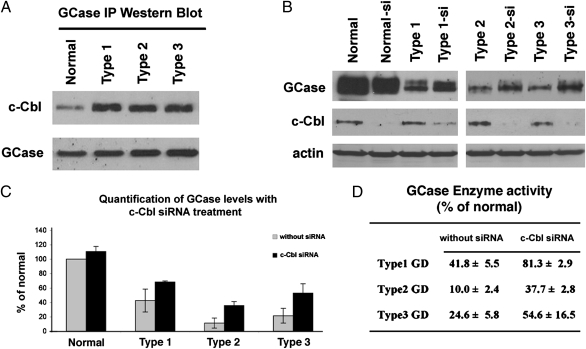
Fig. 5.
siRNA knockdown of c-Cbl and quantification of GCase expression levels. (A) Western blot from GCase-immunoprecipitated (IP) proteins. (Upper) Western blot using c-Cbl antibody on GCase-immunoprecipitated proteins from normal and GD fibroblasts. (Lower) Western blot using GCase antibody on the same proteins. (B Top) Western blot using GCase antibody on normal fibroblasts (control) and from patients with GD before and after siRNA knockdown of c-Cbl. (Middle) Western blot using c-Cbl antibody on control and GD fibroblasts before and after siRNA knockdown of c-Cbl. (Bottom) Western blot using actin antibody on GD and normal fibroblasts. (C) Densitometric measurement of GCase expression levels before (gray bars) and after (black bars) siRNA knockdown of c-Cbl. (D) GCase activity in normal and GD fibroblasts before and after siRNA knockdown of c-Cbl shown as a percentage of GCase activity in normal fibroblasts.

