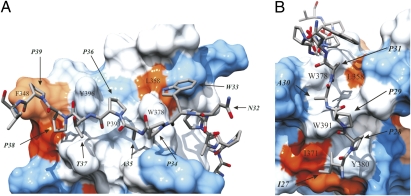
Fig. 2.
Close-ups of C-terminal and N-terminal R475 binding sites on IRTKS SH3 as a hydrophobicity surface presentation. (A) C-terminal binding region. Residues forming the conserved proline-binding pockets are labeled on the surface. Heavy atoms of the C-terminal part of R475 residues N32APTPP39 are highlighted as a stick model: nitrogen (blue), oxygen (red), and carbon (gray). Surface coloring is according to the scale of Kyte and Doolittle (37). Blue corresponds to the most hydrophilic, white to intermediate, and red to the most hydrophobic. (B) N-terminal PPII helix of EspFU R475. The two hydrophobic clefts formed by L358, W378, W391, Y380, and I371 and the heavy atom of R475 residues I27PPAP31 occupying the clefts are shown.

