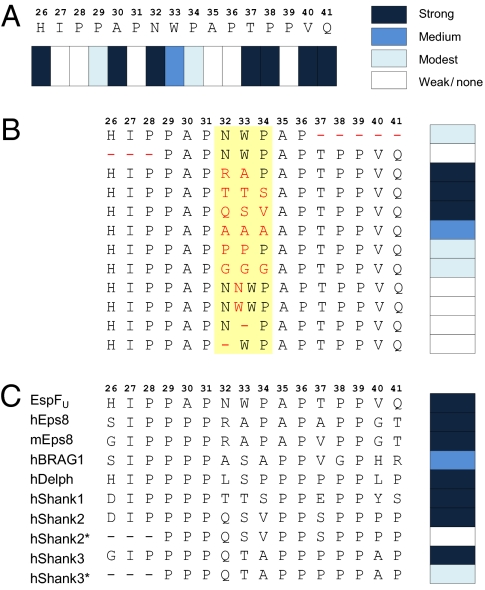
Fig. 3.
Fine mapping of IRTKS SH3-binding preferences. Peptide array technology was used to define the residues critical for IRTKS SH3 binding in the EspFU R475 and in a panel of cellular proteins reported or suspected to interact with IRTKS/IRSp53. (A) Sixteen residues encompassing the region of R475 observed to contact IRTKS SH3 were systematically replaced with Ala. At positions naturally occupied by Ala, an uncharged polar amino acid (Asn) was used instead. Binding signals were quantified and classified into four categories. Strong indicates >85%, medium indicates 30–85%, modest indicates 5–29%, and weak/none indicates <5% of the average signal from triplicate dots printed with the corresponding unmodified peptide. (B) N- and C-terminal ends and the linker region (shaded in yellow) of 16-mer IRTKS SH3-binding peptide were altered as indicated (red font) and examined as above. (C) IRTKS binding of the 16-mer EspFU peptide was compared with that of similar peptides from cellular proteins. Human (h) and mouse (m) Eps8 protein sequence differ in this region and have both been included. N-terminal truncated versions of Shank2/3 peptides (*) were included because an earlier study suggested the minimal IRSp53 SH3-binding site to reside within this sequence (24).

