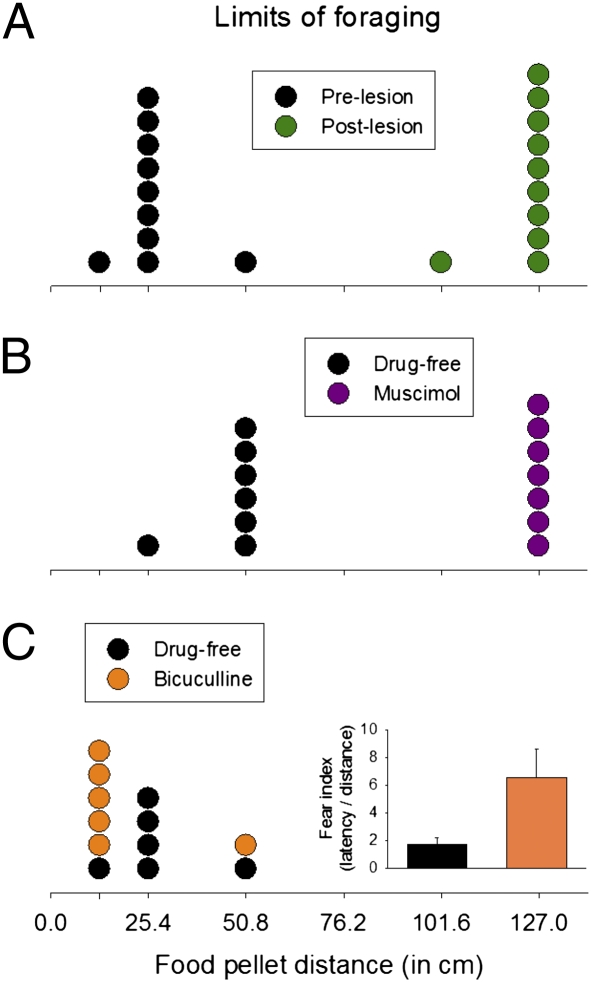
Fig. 2.
Limits of foraging distance. (A) A frequency histogram of maximum successful foraging distances before (black; test day 1) and after (green; test day 2) amygdalar lesions. (B) Maximum successful foraging distances under intraamygdalar muscimol (purple; test day 1) and drug-free (black; test day 2) conditions. (C) Maximum successful foraging distances under drug-free (black; test day 1) and with intraamygdalar bicuculline (orange; test day 2) conditions. Inset shows fear index (latency/distance) between drug-free and bicuculline tests.

