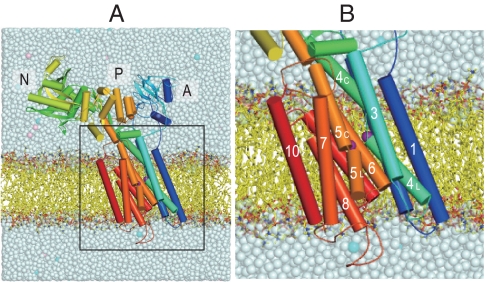
Fig. 1.
A snapshot of the Ca2+-ATPase embedded in the DOPC membrane after 1-ns equilibration. (A) The full model in the simulation. (B) The transmembrane region. Purple spheres represent Ca2+; cyan and pink spheres in salt solution show K+ and Cl-, respectively. Three cytoplasmic domains (A, N, and P), and 10 transmembrane helices (M1–M10) are marked. Several phospholipids and solvent molecules are removed for clarity.

