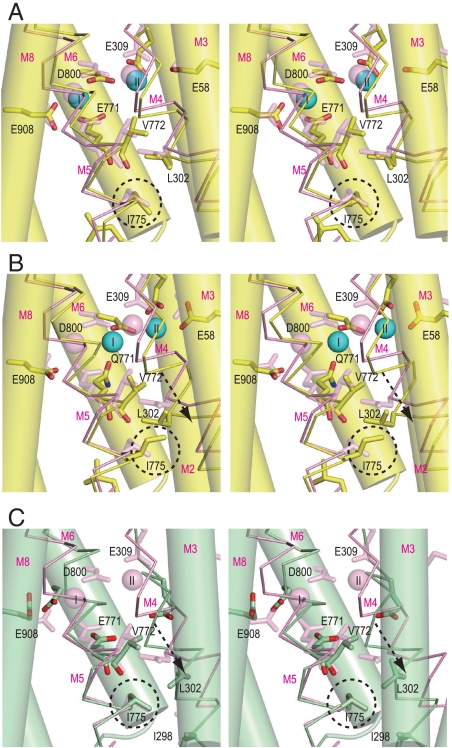
Fig. 5.
Structural changes in the Ca2+-binding sites. Viewed in stereo along the membrane plane. Superimposed on the atomic model of the crystal structure in E1·2Ca2+ (pink) are: (A) WT1 at 10 ns (atom color); (B) E771Q3 at 10 ns (atom color); and (C) crystal structure in E2 (green). The M3, M6, and M8 helices are represented with cylinders, and M4 and M5 with sticks. The arrows in B and C indicate the movements of the M4 helix relative to the rest of the transmembrane helices. Dashed circles locate the Ile775 side chain.

