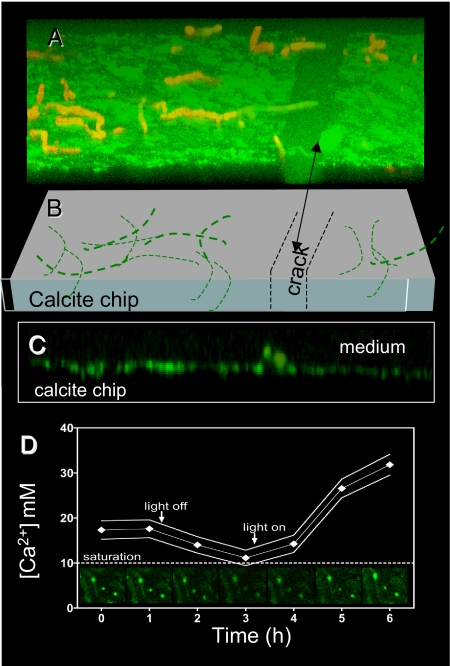
Fig. 3.
Real-time free Ca2+ supersaturation around boreholes during boring of BC008 on calcite. LSCM Images are plane view from live illuminated cultures boring into calcite chips in custom-designed stage incubation chambers. (A) Three-dimensional reconstruction from single optical sections recorded parallel to the chip surface shown at an elevation angle of 30°. Green fluorescence denotes dissolved Ca2+ concentration reported by the externally supplied fluorophore. Red autofluorescence is from photosynthetic pigments (chlorophyll a and phycobilins) and tracks cyanobacterial filaments. (B) In an interpretation of A, thick lines denote that some filaments naturally stick out of the chip and thin lines denote filaments inside the chip. Note that Ca2+ inside a natural crack in the chip is much closer to saturation. (C) Vertical cross-section of the solid/liquid interface reconstructed from data in A (only the green channel is shown). (D) Temporal dynamics of Ca2+ concentration measured around boreholes after changes in stage illumination. Solid lines delimit 2 SD around the mean of n = 10 boreholes. Some source images are shown in the sequence of insets. Ca2+ decreased to saturation within 2 h of turning light (10 W m−2) off. Higher Ca2+ supersaturation was reached within 2 h of turning on illumination at 30 W m−2.

