Fig. 1.
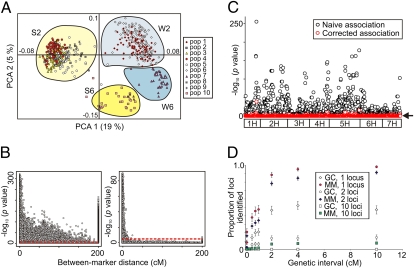
Investigation of genetic substructure. (A) Principle component analysis of UK cultivars and barley progenitor lines (n = 620). Phenotypic combinations for row number (2 = two-row, 6 = six-row) and seasonal growth habit (S, spring; W, winter) are indicated. Varietal membership to the 10 subpopulations identified using STRUCTURE are overlaid. (B) Decay of pair-wise marker LD over increasing genetic distance (cM) before (Left) and after (Right) correction using the mixed linear model. Off-chromosome comparisons are shown at 200 cM. The Bonferroni corrected P = 0.05 significance threshold is indicated. (C) Naïve and corrected GWA analysis of seasonal growth habit illustrating the extent of confounding present. Arrow indicates the significance threshold. (D) Predicted experimental power to detect a trait controlled by 1, 2, and 10 loci (h2 = 0.9) over genetic distance (±cM). Power is measured as the proportion of simulations in which at least one causative locus was detected (q value ≤ 0.1). Error bars denote ±1 SE.

