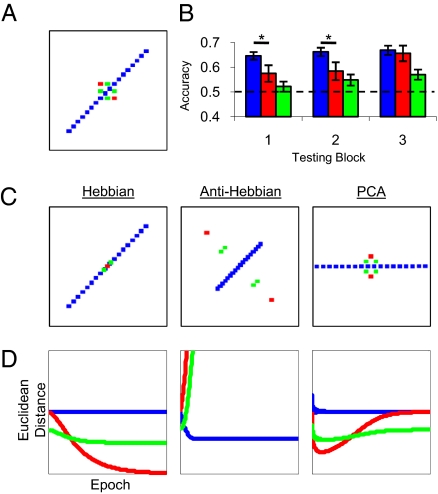
Fig. 4.
Neural network and listener performance in Experiment 2. (A) Listeners discriminated sounds with either a positive correlation between AD and SS (rAD,SS = 0.97, n = 20) or the counterbalanced negative correlation (rAD,SS = −0.97, n = 20). Consistent: blue; Orthogonal: red; Single-cue: green. (B) Listener performance in Experiment 2. The dashed line at 50% accuracy indicates chance performance. Error bars denote SEM. Asterisks indicate significant contrasts of interest assessed by paired-sample t tests following Bonferroni correction for multiple comparisons (P < 0.025). (C) (Left) Model representations of stimuli at the end of simulation. Simulations of the Hebbian network; (Center) anti-Hebbian network; (Right) PCA network. Representations are plotted in first-output-unit by second-output-unit space. (D) Measures of Euclidean distance between test points throughout the simulation for each model.

