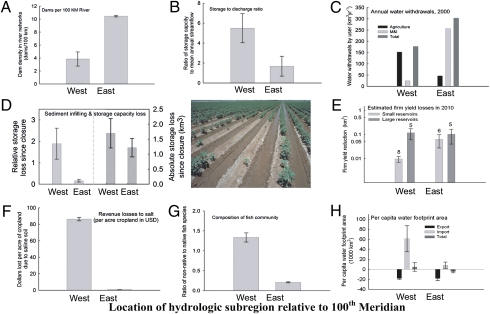
Fig. 2.
Comparison of infrastructure and impacts of infrastructure east and west of the 100th meridian. (A) Average number of dams per 100 km of river length. (B) Relative storage capacity (total reservoir storage/mean annual streamflow). (C) Sum of water withdrawals by category—municipal, industrial, agricultural, and total. (D) Average storage capacity losses in reservoirs as a result of sediment infilling expressed relative to mean annual streamflow (Left) and in absolute terms (km3, Right). (E) Estimated average reductions in firm yield (km3) for large (>1.23 km3) and small (<1.23 km3) reservoirs. Numbers above error bars (±1 SE) are sample sizes in each category. (F) Estimated average revenue losses (millions USD) as a result of salt accumulation in croplands. (G) Average ratio of nonnative to native fishes (color) and number of nonnative species (text). (H) Average per capita virtual water footprints (VWF) for all metropolitan statistical areas >100,000 in size. Footprints are negative if virtual water is exported in crops from the watershed hosting the city, or positive if the city requires imports of virtual water (in crops) to feed the population. Error bars are SEs using hydrologic subregions as the unit of replication (127 and 77 east and west of the 100th meridian, respectively), unless otherwise indicated.

