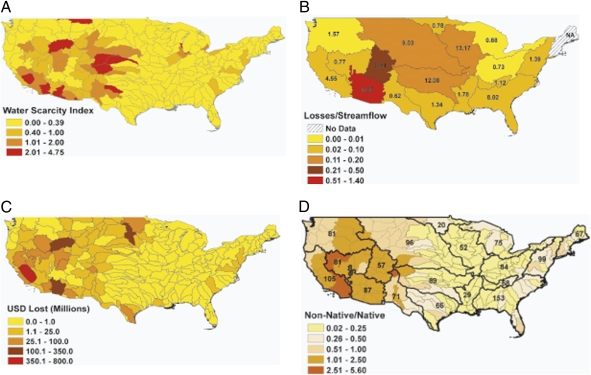
Fig. 3.
Assessment of current freshwater sustainability. (A) WSI for 204 coterminous hydrologic subregions. Here, WSI = W/MAF, where W is total withdrawals based on USGS estimates from 2000, and MAF is total mean annual streamflow, including locally generated streamflow and flow unused by upstream hydrologic regions. (B) Estimated relative (storage loss/streamflow, color coded) and total losses (km3, text) of storage capacity in each USGS hydrologic region due to infilling by sediment. NA in Hydrologic Region 1 indicates no sediment surveys available for reservoirs over 1.23 × 10⁻² km3 in this region (SI Appendix). (C) Agricultural revenue lost (in million USD) at HUC 4 scale due to soil salinization (color coded). (D) Ratio of nonnative to native fish species (color coded) and total number of observed nonnative species (text).

