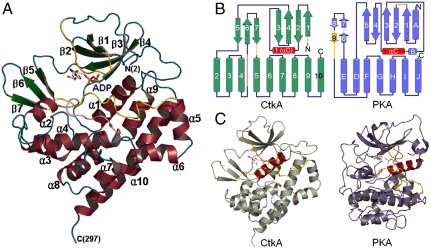
Fig. 1.
Overall structure of CtkA. (A) Ribbon diagram. α-Helices, β-strands, and loops are colored in wine, green, and cyan, respectively. The glycine-rich loop (Lys14–Gly22), catalytic loop (Gly152–Trp161), and activation loop (Ala175–Asp189) are colored in orange, pink, and yellow, respectively. Secondary structure elements were defined by PyMOL (http://www.pymol.org). All the structural figures were generated using PyMOL. (B) Comparison of topology diagrams of CtkA and PKA. α-Helices are shown as cylinders and β-strands as arrows. αC helix is colored in red for both proteins. (C) Overall structures of CtkA and PKA. Bound ADP molecules are shown in sticks, and αC helix is colored in red for both proteins. The glycine-rich loop (Lys14–Gly22), catalytic loop (Gly152–Trp161), and activation loop (Ala175–Asp189) of CtkA are colored in orange, pink, and yellow, respectively.

