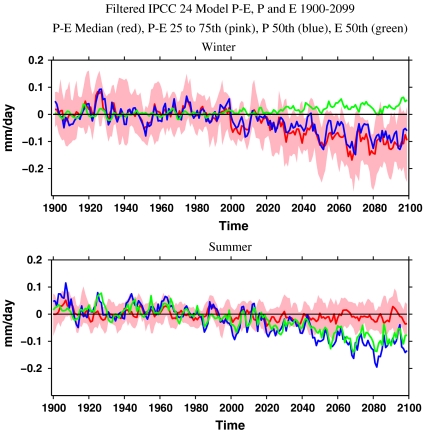
Fig. 1.
Time series for 1900–2099 of the median of 24 IPCC AR4 models’ simulated and projected change in P - E (Red), with 25th and 75th percentiles of the distribution (Shading), P (Blue), and E (Green) for the winter (Oct–Mar, Top) and summer (Apr–Sep) half years and averaged across the SWNA land region, relative to 1950–1999 climatologies. Units are mm/day.

