Fig. 2.
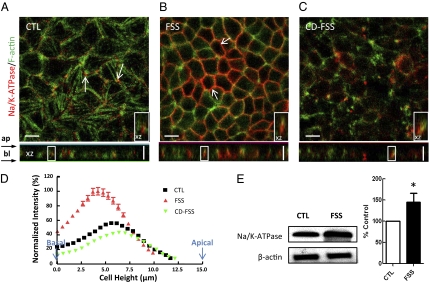
Effect of FSS (3 h at 0.2 dynes/cm2) on Na/K-ATPase trafficking and expression in MPT cells. Immunofluorescence images of MPT cells under control (CTL) (A), FSS (B), and cytochalasin D (CD-FSS) conditions (C). The antibody stained for Na/K-ATPase (red) and actin filaments (green), respectively. In CTL, Na/K-ATPase weakly distributed mainly at the basolateral membrane with some intensive staining near the cell-cell contacts (arrows). After FSS, an elevation in membrane Na/K-ATPase expression was observed mainly at the cell periphery (arrows). Colocalization of Na/K-ATPase and actin was prominent (XZ image, Inset). CD significantly blunted the flow-dependent effects. (D) Distributions of normalized Na/K-ATPase-stained fluorescence intensity. The fluorescence intensity of the cells was shifted to the left (cell base) after application of FSS (red line). This effect was blunted with the addition of CD (green line). (E) Na/K-ATPase and actin control were detected by Western blot. Results in bar graph are means ± SE and are percentage of control condition (*P < 0.05). (Inset) Magnified view of the boxed region on XZ images (10 × 5 μm). (Scale bars, 10 μm.)

