Fig. 4.
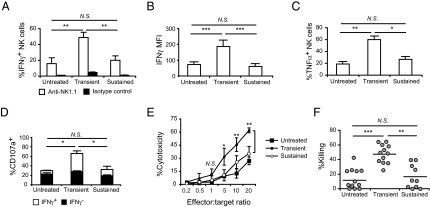
Impaired effector function of NK cells upon sustained in vivo stimulation with IL-15/IL-15Rα complexes. (A) Percentage of IFNγ+ NK cells in spleen (gated on CD49b+CD3ε− cells) upon 5-h anti-NK1.1 stimulation (n = 5). White bars, anti-NK1.1 (PK136); black bars, isotype control. (B) IFNγ production by NK cells upon 5-h PMA/ionomycin stimulation. MFI of IFNγ+ NK cells shown for spleen (n = 11). (C) TNFα production by NK cells upon 5-h PMA/ionomycin stimulation. Percentage of TNFα+ NK cells shown for spleen (n = 3). (D) Degranulation of NK cells indicated by CD107a staining. Splenocytes were stimulated on anti-NK1.1–coated plates and intracellularly stained with anti-IFNγ. Percentage of CD107a+ IFNγ− (black) and IFNγ+ (white) NK cells shown (n = 6–7). (E) Cytotoxicity of NK cells analyzed in vitro. NK cell-enriched splenocytes were cultured with a constant number (1 × 10⁴) of YAC1 cells at different effector:target ratios as indicated for 4 h and cytotoxicity was measured by lactate dehydrogenase release assay. Filled square, untreated; filled circle, transient; open circle, sustained (n = 3). (F) Cytotoxicity of NK cells analyzed in vivo by CFSE-based assay. Percentage of in vivo killing in untreated (n = 12) mice or upon transient (n = 12) and sustained (n = 10) treatments calculated as described in Materials and Methods. Each circle represents an individual mouse. Lines indicate the average value. Significance: *P < 0.05, **P < 0.01, ***P < 0.001; NS, not significant. Data are means ± SD.

