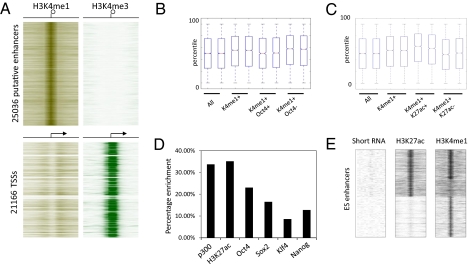
Fig. 1.
H3K27ac is a good candidate to distinguish active from inactive enhancer elements. (A) Heatmap of 25,036 putative enhancers based on H3K4me1 enrichment and H3K4me3 depletion in ES cells. Eight-kilobase pairs around the center of the enhancer region are displayed. (B) Gene expression of microarray data generated in duplicates in ES cells. Box-plots show all genes (All) and genes found associated with enhancers (H3K4me1+) either enriched (+) or unenriched (−) for Oct4 or (C) H3K27ac. Solid bars of boxes display the 25–75% of ranked genes with the mean indicated as an intersection. (D) Graph showing the percentage of enhancers identified in A that are called bound at P = 10−8 by the indicated factors or chromatin marks. (E) Heatmap showing a composite of distal H3K27ac- and H3K4me1-enriched regions ordered by presence and absence of these two histone marks. Left: Occurrence of short RNA reads based on this distribution within a −8 kb to +8 kb window (SI Materials and Methods).

