Fig. 5.
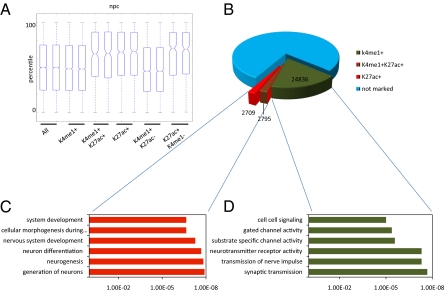
Poised and active enhancers can discriminate between current and future developmental states. (A) Gene expression of microarray data generated in duplicate from neural progenitors. Box-plots show all genes (All) and genes found specifically associated with enhancers in neural progenitors either enriched (+) or unenriched (−) for H3K4me1 or H3K27ac. A hierarchical model corrects for multiple enhancers being associated with single genes (SI Materials and Methods). Solid bars of boxes display the 25–75% of ranked genes, with the mean as an intersection. (B) Pie chart showing the distribution of H3K4me1 marked (green) and H3K27ac marked (red) enhancers in neural progenitors as indicated. In blue are unmarked enhancers. Total enhancers are based on combining distal H3K4me1- and H3K27ac-enriched regions totaling 136,397 regions enriched. Lines indicate the section of enhancers used to derive the genes for GO analysis in C and D. (C and D) GO analysis displaying gene functions for genes specifically associated with enhancer activity in neural progenitors split according to either H3K4me1 enrichment but absence of H3K27ac enrichment (C, green bars) or H3K27ac enrichment (D, red bars). Displayed is a representation of GO functions found.

