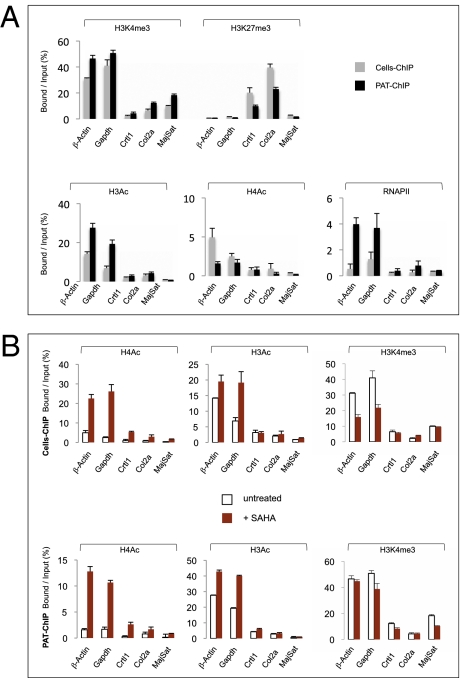
Fig. 2.
PAT-ChIP validation and its application to monitor dynamic changes of the epigenome induced by in vivo treatment of APL mice with SAHA. (A) Comparison of Cells-ChIP and PAT-ChIP results obtained by qPCR analysis of selected genomic regions. Enrichment of the promoter sequences associated with the indicated genes for several histone marks (H3K4me3, H3K27me3, H3Ac, H4Ac, and RNAPII) is expressed as the ratio between bound and input (percentage). Gray bars: canonical Cells-ChIP. Black bars: PAT-ChIP. (B) Enrichments of the promoter sequences associated with the indicated genes are reported as bound/input ratio for untreated (white bars) and SAHA-treated (red bars) mice. Upper: Cells-ChIP results. Lower: PAT-ChIP results. Data are expressed as means ± SD (for statistical analysis see Table S1 A and B).

