Fig. 3.
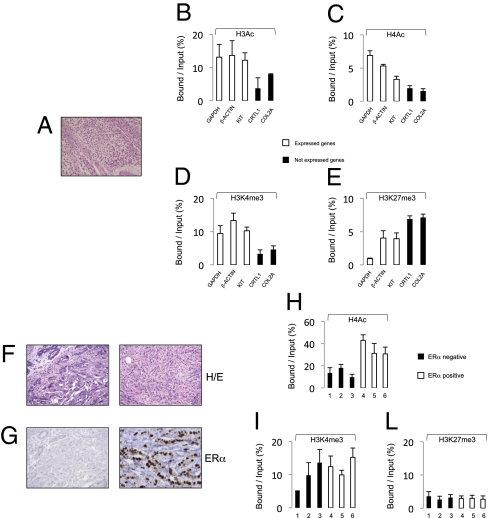
Application of PAT-ChIP to human FFPE samples. (A–E) PAT-ChIP analysis of a TGCT FFPE sample tissue. (A) H&E staining of human seminoma (TGCT). PAT-ChIP assays conducted against (B) H3Ac, (C) H4Ac, (D) H3K4me3, and (E) H3K27me3 are shown. (F–L) PAT-ChIP analysis of the ERα promoter in human breast carcinoma. (F) H&E staining of breast cancer cases representative of ERα negative and positive samples and (G) immunohystochemical analysis of relative ERα expression. PAT-ChIP assays conducted against (H) H4Ac, (I) H3K4me3, and (L) H3K27me3 are shown. Enrichment of the promoter sequences associated with the indicated genes is reported as bound/input ratio for expressed genes (white bars), not-expressed genes (black bars, B–E), and for ERα negative (black bars) and ERα positive (white bars, H–L) breast cancer cases. Data are expressed as means ± SD.

