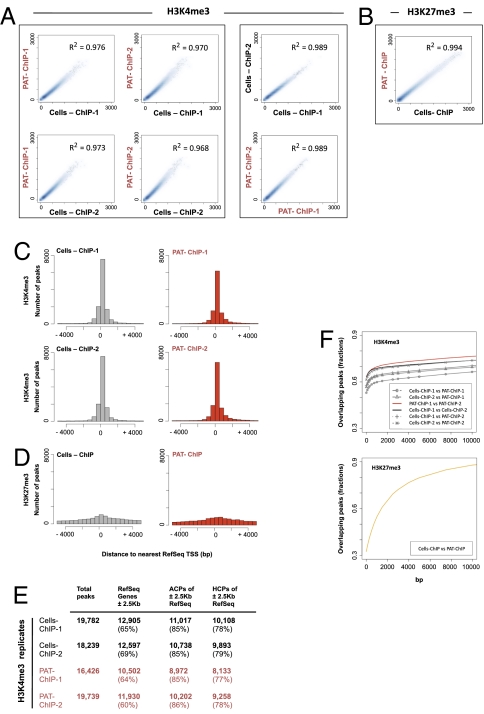
Fig. 4.
PAT-ChIP-Seq analysis of H3K4me3 and H3K27 me3 in APL mice. (A and B) Reads from the ChIP-Seq experiments were counted within each 100-kbp window, used to scan the mouse genome. Scatterplot analysis of the read numbers were drawn for (A) H3K4me3 and (B) H3K27me3 immunoprecipitations, identified within Cells-ChIP-Seq and PAT-ChIP-Seq experiments. Linear regression was performed for each of the analyzed comparison. Coefficients of determination are indicated. (C and D) Peaks density in proximity of the transcription start site (±5 Kb from TSS) referred to (C) H3K4me3 and (D) H3K27me3 immunoprecipitation. (E) Distribution of peaks with respect to functional genomic regions: ±2.5 Kb across TSS peak RefSeq annotated genes, percentage of ACPs, and percentage of HCPs, referred to the ±2.5 Kb surrounding RefSeq genes TSS. (F) Analysis of the overlaps between Cells-ChIP and PAT-ChIP peaks. Two peaks were considered as overlapping if they were found within a fixed number of base pairs from each other (x-axis values). Percentages of peaks in Cells-ChIP datasets that were found in the PAT-ChIP (y-axis values) were then plotted in function of the distance to consider two peaks as overlapping. Results for H3K4me3 (Upper) and H3K27me3 (Lower) are shown.

