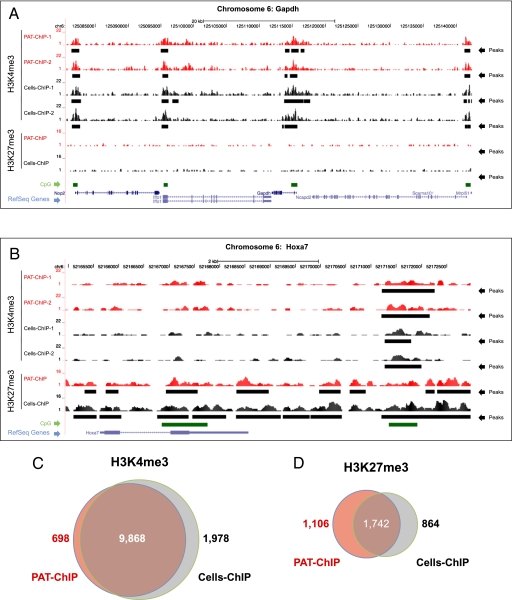
Fig. 5.
PAT-ChIP-Seq analyses of H3K4me3 and H3K27me3 in APL mice. (A and B) Profiles of H3K4me3 and H3K27me3 signals along the mouse Gapdh locus (representative of an H3K4me3 enriched region) and the Hoxa7 locus (representative of an H3K27me3 enriched region) are reported for Cells-ChIP (black) and PAT-ChIP (red). Identified peaks (black bars) are marked below the corresponding profile. HCP regions are reported as green bars, and Ref-Seq genes are indicated in blue (screenshots obtained using the University of California, Santa Cruz Genome Browser). (C and D) Venn diagrams showing common and unique peak-containing promoters identified by Cells-ChIP-Seq (gray) and PAT-ChIP-Seq (red).

