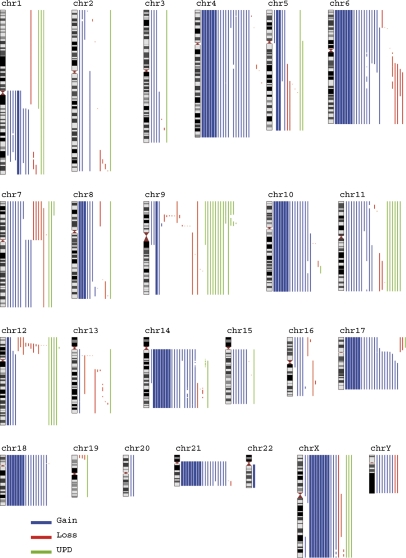
Fig. 2.
Overview of acquired genetic imbalances and UPIDs detected by SNP array analysis in 74 cases of high hyperdiploid childhood ALL. Each line corresponds to an aberration in the chromosome on the left. Thin lines correspond to aberrations detected in one case; thicker lines indicate aberrations detected in eight cases. Blue lines denote gains, red lines denote losses, and green lines denote UPIDs. This figure was made using the Genome-Wide Viewer software, freely available at http://www.well.ox.ac.uk/~jcazier/GWA_View.html.

