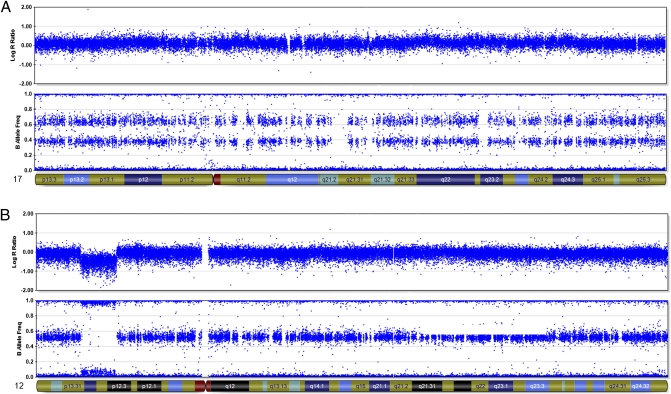
Fig. 3.
Examples of SNP array data from case 56. Top panels show log2 ratios along the chromosomes. Each dot represents the log2 ratio of one marker. A log2 ratio of zero corresponds to a normal, diploid copy number. Increased and decreased log2 ratios correspond to gained and deleted regions, respectively. Lower panels show B allele frequencies (BAF), which are calculated as (signal intensity for allele B)/(signal intensities for allele A + allele B). Homozygous SNPs have a value of 0 or 1, and heterozygous SNPs a value of 0.5 in a diploid chromosome segment. (A) Chromosome 17. Trisomy for this chromosome is apparent as an increased average log2 ratio and BAF values of 0, ~0.33, ~0.67, and 1.0, where the middle values correspond to the heterozygous SNPs. (B) Chromosome 12. Disomy for this chromosome is apparent as an average log2 ratio of ~0 and BAF values of 0, ~0.5, and 1.0. A hemizygous deletion is seen in 12p12.3–13.3 including ETV6, visible as a log2 ratio of less than −0.5 and complete loss of heterozygosity (i.e., BAF values of 0 and 1.0 only). The panels were extracted from the BeadStudio 3.1.2.0 software with Illumina Genome Viewer 3.2.9.

