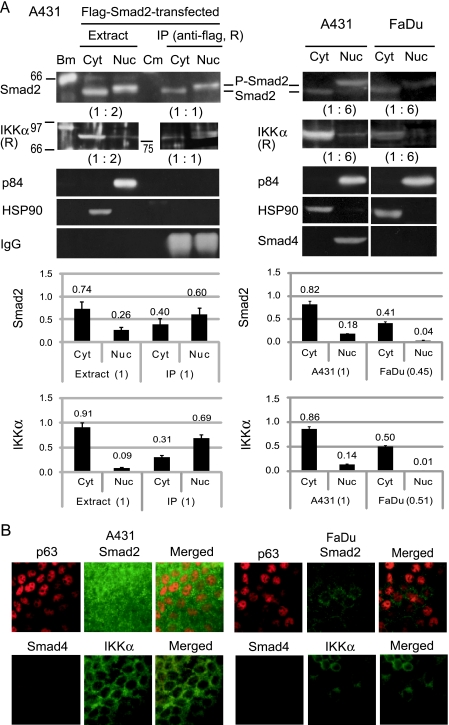
Figure 5.
Status of the signaling molecules in A431 and FaDu. (A) Smad2 and IKKα were analyzed for the level of expression and subcellular localization by Western blot analysis. (Left panels) Cytosolic (Cyt) and nuclear (Nuc) fractions were obtained from A431 cells transfected with the Flag-Smad2 expression vector. Immunoprecipitation (IP) was carried out with a rabbit (R) anti-Flag antibody (PM020). Blot membrane was probed with anti-Smad2 (sc-101153), anti-IKKα (sc-7218), anti-p84 nuclear protein (ab487), and anti-HSP90 (ab1429) antibodies. Sizes (in kDa) and positions of the biotinylated standard proteins (Bm) and prestained color marker proteins (Cm) are indicated. Positions of Smad2 and phosphorylated Smad2 (P-Smad2) reactive with an anti-phospho-Smad2 (Ser465/467) antibody (#3101) are also indicated. Ratios of the sample amounts analyzed are indicated in parentheses. Graphs show relative amounts of Smad2 and IKKα in the fractions as determined by measurement of the band intensities (n = 3). (Right panels) Cytosol (Cyt) and nuclear (Nuc) fractions from untransfected A431 and FaDu cells were examined. Protein band intensities were measured and standardized with HSP90 and the ratio of sample amounts (1:6). Graphs show comparison of the total amount and subcellular distribution of Smad2 and IKKα between A431 and FaDu (n = 3). (B) Immunofluorescence analysis of formalin-fixed A431 and FaDu cells. Scale bars, 50 µm.

