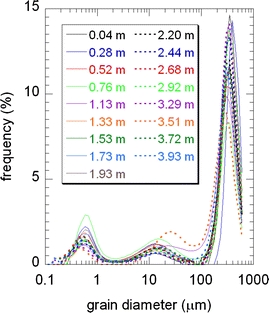
Fig. 3.

Grain size distributions of seventeen sand samples of the A1 point cores wherein no oil contamination was found. The sampling depth is indicated. The sum of the frequency over 64 bins along the grain diameter axis is 100%. Note that the grain size distribution is almost depth independent and the statistical mode of the histogram is as coarse as about 300 μm
