Fig. 9.

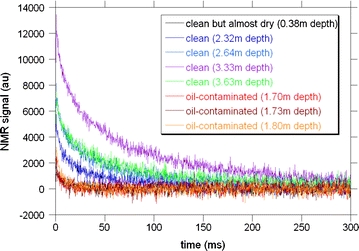
Eight examples of CPMG waveform data (arbitrary units) for soil cores from the A12 point. The depth of the measured core portions and the degree of oil contamination are indicated. Clean indicates that the pore fluid is water (not oil)

Eight examples of CPMG waveform data (arbitrary units) for soil cores from the A12 point. The depth of the measured core portions and the degree of oil contamination are indicated. Clean indicates that the pore fluid is water (not oil)