
Figure 3.
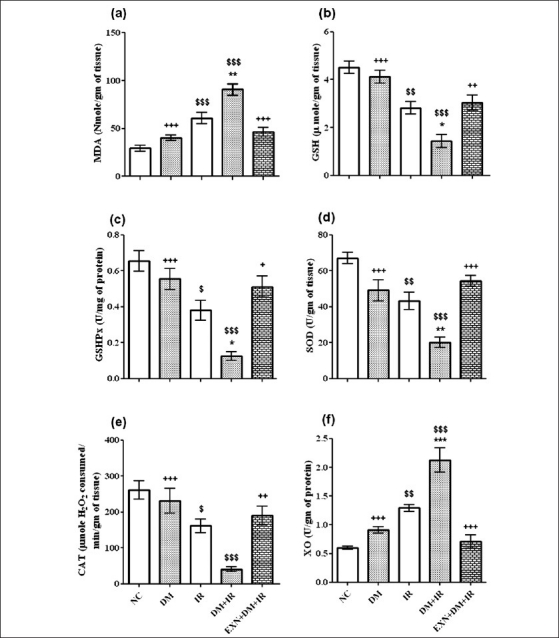
Effect of exenatide on lipid peroxidation (a), reduced glutathione (b), glutathione peroxidase (c), superoxide dismutase (d), catalase (e) and xanthine oxidase (f) in liver after renal IR in diabetic rats. Values are mean ± SEM (n= 6), analyzed by one-way ANOVA followed by Bonferroni multiple comparisons test. $, *,+ P < 0.05; $$,**,++ P < 0.01; $$$,***,+++ P < 0.001. $ Compared with normal control, * Compared with IR, + Compared with DM+IR group