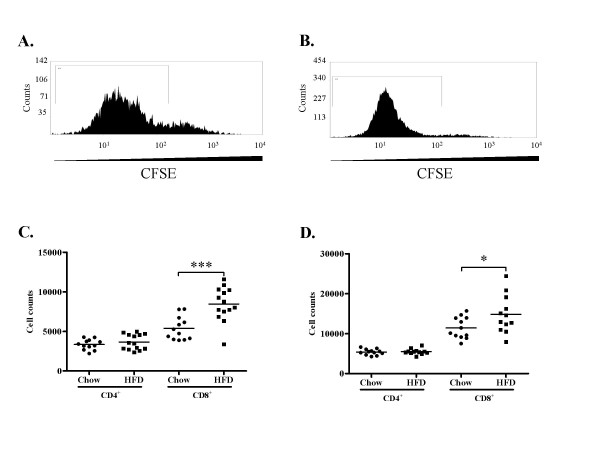
Figure 9.
Proliferation of CD4+ and CD8+ cells in spleen. Representative histograms of (A) CD4+CFSE+ and (B) CD8+CFSE+ cells. Gates depict cells proliferating >1 time. (C-D) Proliferation of CD4+ and CD8+ T cells in mice fed chow or high fat diet (HFD) at 4 (C) and 8 (D) weeks of diet. *P < 0.05, ***P < 0.001.

