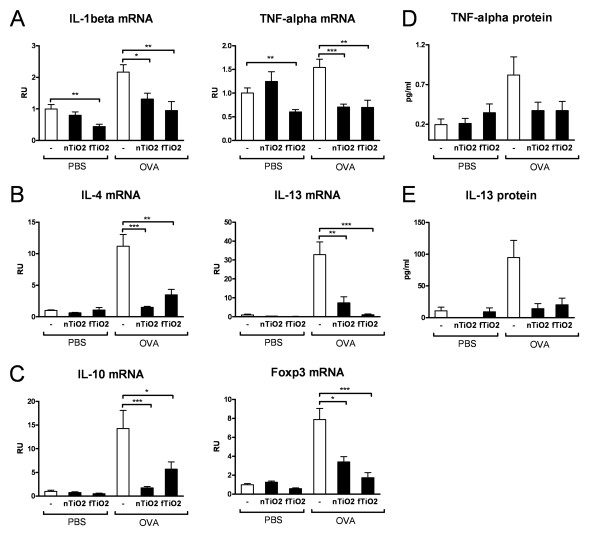
Figure 6.
mRNA and protein expression of cytokines. Relative mRNA-expression in the lung tissue of (A) proinflammatory cytokines, IL-1β and TNF-α, (B) Th2 type cytokines IL-4 and IL-13, (C) regulatory cytokine IL-10 and marker of regulatory T-cells Foxp3. Protein levels (pg/ml) of proinflammatory cytokine TNF-α (D) and Th2-type cytokine IL-13 (E) in BAL supernatant of mice. Results are shown in relative units (RU) or (pg/ml) for healthy (PBS) and allergic (OVA) mice exposed for 2 hours a day, three days a week, for four weeks at a concentration of 10 mg/m3 to nanosized (nTiO2) or fine (fTiO2) TiO2 or left unexposed (-). N = 8 mice per group. The bars represent mean ± SEM; * P < 0.05, ** P < 0.01, and *** P < 0.001 significantly different from unexposed control; Mann-Whitney U test.

