
Figure 5.
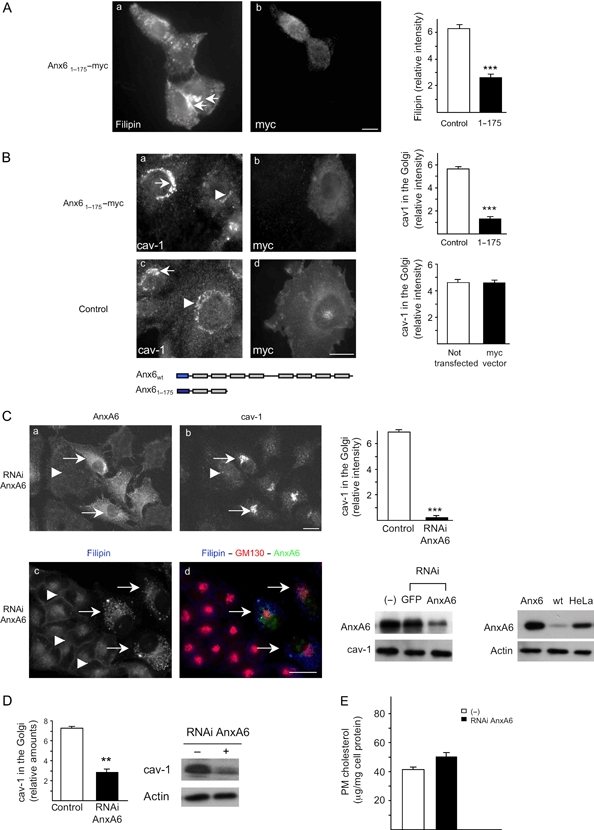
Expression of an N-terminal deletion mutant or knock down of AnxA6 restores the cellular distribution of cholesterol and cav-1.A) The CHOanx6 cells were transfected with Anx61–175−myc (a and b), fixed, stained with filipin (5 μg/mL) (a) and immunolabeled with anti-myc (b) as indicated. Arrows point at vesicular, cholesterol-containing structures (a). Loss of strong perinuclear filipin staining was observed in 50% of transfected cells in five independent experiments and quantified. The mean ± SD of the relative filipin intensity in the perinuclear region is given. B) The CHOanx6 cells were transfected with Anx61–175−myc (a and b) and empty vector (c and d). Twenty-four hours after transfection, cells were fixed, permeabilized and immunolabeled with anti-cav-1 (a and c) and anti-myc (b and d) as indicated. As shown in the schematic diagram, myc-tagged Anx61–175 contains the N-terminal signal peptide (blue) and two out of eight AnxA6-membrane-binding repeats (gray). Arrows point at the increased amount of cav-1 in the Golgi of non-transfected and vector-transfected CHOanx6 cells (a and c). Arrowheads point at reduced and unchanged cav-1 staining at the Golgi in Anx61–175-transfected (panel a) and control cells (panel c), respectively. Reduced cav-1 staining in the Golgi region upon Anx61–175 expression was observed in 45–55% of transfected cells in five independent experiments. The fluorescence intensity of the cav-1 staining at the Golgi in Anx61–175-transfected versus non-transfected (panel a) and myc-transfected cells (panel c) were quantified. Values represent the mean ± SD of 50 cells per cell line in each experiment (n = 5). ***, p < 0.001 for Student’s t-test. Bar is 10 μm. C) HeLa cells were transfected with RNAi targeting AnxA6 (RNAi–AnxA6) as described (15). Seventy-two hours after transfection, cells were fixed, permeabilized, immunolabeled with anti-annexin A6 (AnxA6), anti-cav-1 (cav-1) and anti-GM130 and stained with filipin as indicated. Arrowheads point at cells with downregulated AnxA6. Arrows show cells with unchanged AnxA6 expression levels and cav-1 staining (a and b) and vesicular filipin staining (c and d). In three independent experiments, reduced amounts of cav-1 in the Golgi region (a and b) and increased filipin staining at the PM (c and d) were observed in 60–70% of AnxA6-depleted cells. The fluorescence intensity of the cav-1 staining at the Golgi area in non-depleted/depleted cells was quantified. Values represent the mean ± SD of three independent experiments. ***, p < 0.001 for Student’s t-test. Expression levels of AnxA6 in CHOanx6 (Anx6), CHOwt (wt) and HeLa ± RNAi are given. Bar is 10 μm. D) HeLa cells were transfected with RNAi–AnxA6 as above. Seventy-two hours after transfection, Golgi–caveolin was immunoprecipitated as described in Figure. 4C. The relative amount of cav-1 in the Golgi was quantified and normalized to actin. Results represent the mean ± SD of three independent experiments with duplicate samples. **, p < 0.01 for Student’s t-test. E) The PM cholesterol (μg/mg cell protein) was determined as described above (Figure 2C) from HeLa cells transfected ± RNAi–AnxA6 (in triplicate) and normalized to cellular protein. The mean ± SD is given and is representative for two independent experiments.