
Figure 7.
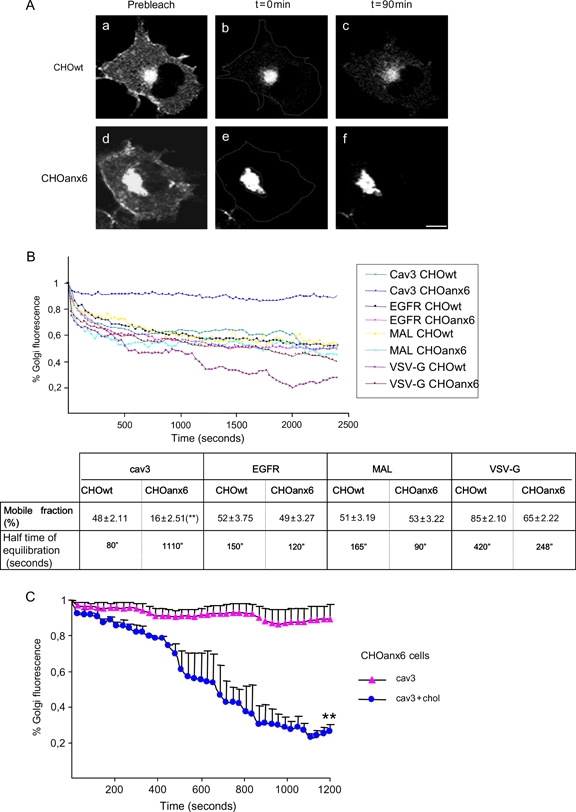
Annexin A6 modulates the export of caveolin from the Golgi.A) The CHOwt and CHOanx6 cells were transfected with GFP–cav3 and imaged before and after photobleaching of the entire cell except for the Golgi region. The loss of fluorescence signal (iFRAP) from the Golgi was monitored by time-lapse microscopy. To avoid fluorescence recovery from the novo synthesis, cells were treated with Cyhx. Representative Golgi images from CHOwt (a–c) and CHOanx6 (d–f) cells show GFP–cav3 localization before (a and d) and after bleaching at t = 0 min (b and e) and t = 90 min (c and f), respectively. A representative image from four independent experiments is shown. Bar is 10 μm. B) Quantification of Golgi iFRAP kinetics of GFP–cav3, EGFR–GFP, GFP–MAL and VSV-G–GFP in transfected CHOwt and CHOanx6 cells. Images were taken every 30 seconds (see Materials and Methods, t = 0–2500 seconds). Kinetic parameters (mobile fraction in % ± SD and half time of equilibration in seconds) for each protein in both cell lines from four independent experiments are given. **, p < 0.01 for Student’s t-test. C) Quantification of Golgi iFRAP kinetics of CHOanx6 cells transfected with GFP–cav3 as described in A and incubated ± cholesterol for 20 min as indicated. Images were taken every 30 seconds. The amount of the mobile fraction ± SD (%) in the Golgi is shown.