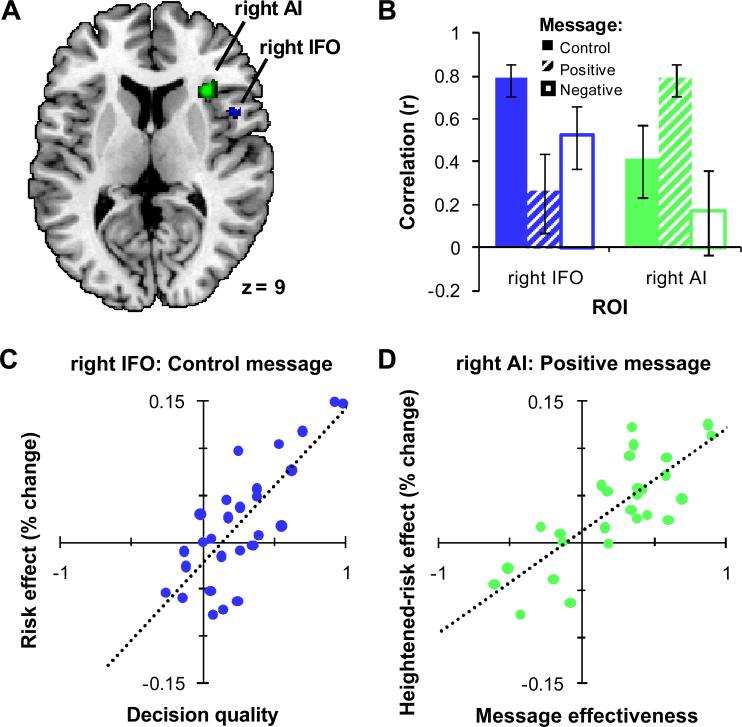
Figure 3.
Correlations of behavioral and neural measures during control and positively-framed message blocks. (A) Shown in blue is a region of right IFO (BA 44, peak voxel: MNI 48, 10, 10) where, for the control message, there was a correlation between decision quality (DQ) and the risk effect. Shown in green is a region of right AI (BA 13, peak voxel: MNI 34, 24, 8) where, for the positively-framed message compared to the control message, there was a correlation between message effectiveness (ME) and the heightened-risk effect. Transverse section of the human brain (MNI z = 9). The skull-stripped single-subject MNI CH2BET template was used as the background brain image in this and all subsequent figures. (B) Follow-up ROI analyses in the two regions described in A for the correlation of DQ and the risk effect with the control message (solid), the correlation of ME and the heightened-risk effect with the positively-framed message (hatched), and the correlation of ME and the heightened-risk effect with the negatively-framed message (outline). Note that the definition of these ROIs biases these comparisons in the direction found. Error bars indicate SEM. (C and D) Plots of the control message correlation in right IFO (blue) and the positively-framed message correlation in right AI (green). Each point represents a participant. The dotted lines show the best-fit linear regressions.

