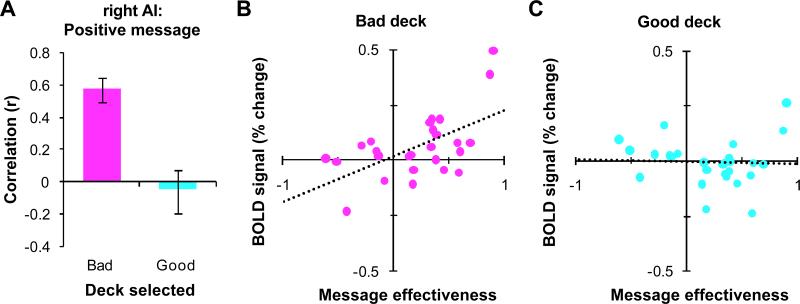
Figure 4.
ROI analysis for the right AI region shown in Figure 2A identified by the correlation of message effectiveness (ME) and the heightened-risk effect for the positively-framed message. (A) Correlation between ME and activation associated with selections from bad decks (magenta) and good decks (cyan) for the positively-framed message compared to the control message. Error bars indicate SEM. (B and C) Plots of the correlations shown in A for selections from bad decks (magenta) and good decks (cyan). Each point represents a participant. The dotted lines show the best-fit linear regressions.

