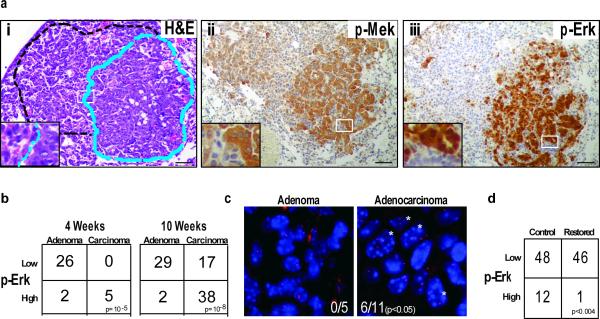
Figure 3. Adenocarcinomas are typified by amplified MAPK signaling.
a, Serial tumour sections of a mixed grade tumour stained with (i) H&E, (ii) anti-p-Mek, or (iii) anti-p-Erk. Dashed lines outline high-grade (blue) and low-grade (black) areas. b, Contingency tables representing number of tumours with high or low MAPK signaling, and the corresponding tumour grades in KrasLA2/+;Trp53+/+ and KrasLA2/+;Trp53LSL/LSL at the four and ten-week time points. c, A subset of tissue sections from a were stained with BAC probes surrounding the Kras locus on mouse chromosome 6. Kras signals (red) and DAPI/DNA (blue) counter stain are shown in an adenoma and a carcinoma. Asterisks indicate nuclei with greater than two Kras signals. d, Contingency plot of tumours with high p-Erk staining shows significantly fewer tumours with high p-Erk staining after Trp53 restoration.

